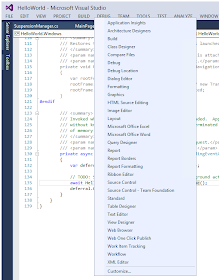
The Debug Location toolbar facilitates Visual Studio's ability to simulate run states for Windows Store applications. To verify that the Debug Location toolbar is enabled, right click on Visual Studio menus. The Debug Location menu item should appear as checked in the context menu displayed. Shown below is a screenshot from Visual Studio 2013 where the Debug Location toolbar is not checked and hence currently visible:
The Debug Location toolbar can also be displayed using menus: View | Toolbars | Debug Location.
When visible the Debug Location toolbar is as follows (the Debug Location toolbar below is split for readablity):
The steps to simulate events in Visual Studio (suspending, terminating and restoring) are as follows:
- Run the Windows Store application in the debugger: Debug | Start Debugging or shortcut, F5
- Return to Visual Studio by pressing Alt-Tab
- Click on the Lifecycle Events drop down on the Debug Location task bar
The items under the Lifecycle Events drop down ("Suspend", "Resume" and "Suspend and shutdown") correspond to the Windows Store application run state to be simulated by Visual Studio.


No comments:
Post a Comment